Site Operations
Settings & maintenance
From site settings to release records and backups, see the foundations of your operation in the admin.
Handle basic settings such as the site name and brand colors, plus plugins and redirects, all in the admin. The public site is exported as static HTML, and deploy history, scheduled jobs, database backups and external API costs can all be checked in the same place.
Prerequisites
- DataForSEO / OpenRouterExternal API costs (shows spend for the services you use)
The other screens work without any external service.
01Site settings
Every site setting, organized in tabs
Set the details that define your site, such as the site name, CMS name, brand colors and logo icon, on the General tab. Settings for SEO, builds, the footer, custom code, notifications and more are edited from the same screen by switching tabs. Define a preview URL pattern once, and each article's preview address follows automatically.
- The site name, and the CMS name shown in the sidebar and login screen
- Brand and hover colors set as color codes
- Pick the logo from an icon set, or type text directly
- Preview URLs are built by replacing {slug} with the article slug
02Theme
Keep generated images on-brand with prompts
Manage the site's tone and style guide, and the prompts used to generate featured images and SEO daily report images, on this screen. To change the feel of the site, just rewrite the prompts here. Save a field empty to return to the default template.
- Separate prompts for featured-image regeneration, SEO daily report images and more
- Article titles and summaries are inserted automatically via placeholders
- Specify a reference image that sets the visual taste
- “Reset to default” returns to the initial template at any time
03Core & plugins
See the core version and every plugin at a glance
Check the CMS core version, the schema status and your installed plugins on one screen. Plugins have two layers, Laravel (admin) and Next.js (public site), so an industry-specific plugin, for example, can extend both admin features and public pages. The core update steps are shown on screen, so updating feels much like a WordPress core update.
- Shows the core version and whether the schema is up to date
- Lists each plugin's version, description and status
- Add features in two layers: Laravel and Next.js
- Generate a scaffold with php artisan plugin:make
04Redirects
Change URLs without losing readers on old links
Manage 301 redirects as rules for when you change an article's URL or clean up old pages. Search by source path and filter by enabled or disabled, so you can find the rule you need even as the list grows. Rules are applied to the public site at build time.
- See source, destination and status code in one list
- Search by path and filter by all, enabled or disabled
- Add, edit and delete rules from the screen
- Disable a rule to pause it without deleting it
05HTML check
Full-text search the HTML before it goes live
Run a full-text search over the built HTML files to confirm that specific wording is not left behind. On top of the automatic checks for banned words, the 404 page and internal links that run on every build, use it whenever you want to check a particular term on the spot. If nothing matches, it says so along with the number of files searched.
- Switch between plain-text and regular-expression (PCRE) search
- Regex mode supports Japanese, with an option to ignore case
- Shows the search target and the time of the last build
- Catch leftover placeholder text before publishing
06Releases
A record of what went live, deploy by deploy
Every production deploy is recorded, and you can look back through the latest 100. Alongside the deploy time, version, commit and branch, you see the file count, size, duration and IndexNow submissions, so you can compare the scale and outcome of each release. You can also look up an article's IndexNow submission history by its slug.
- Lists deploy time, version, commit and message
- Records file count, size, duration and status
- Shows IndexNow submissions for each release
- Search IndexNow submission history by article slug
07Release details
Trace a single release through its diff and context
For a single release, cards show the deploy time, commit, size, duration and status. Open the diff against the previous release on GitHub to read every change this deploy took to production. You can also jump to the previous release, the day's deploy list or that day's conversion report, and review what you shipped alongside the results.
- View the diff from the previous release, or the single commit, on GitHub
- The commit message, with a link to the related task
- Jump to the previous release, the day's deploys or that day's conversion report
- Check the IndexNow submissions sent with that release
08Scheduled jobs
Make background jobs visible in one list
Every job that runs on a schedule in the Docker scheduler, such as backups, data imports and aggregation, is listed here. Jobs are grouped by category, such as system and conversions, with their schedule and whether logs exist. Where jobs are defined, how to read the logs and the commands for manual runs are on the same screen, so you don't lose time hunting for them.
- Jobs listed by category, each with its schedule
- Covers everything from daily runs to imports every few minutes
- Shows where definitions, the runner container and logs live
- Includes commands for manual runs when debugging
09Database backups
Confirm at a glance that backups are running
Check the database dump history and whether the scheduled run (cron) is working on this screen. Cards show health, last run, latest file size and cron status, so you can tell at a glance that backups haven't stopped. The history lists files within the retention period, and each one can be downloaded.
- Health is judged by a successful run within the last 48 hours
- Confirm scheduled runs from cron's last heartbeat
- History listed by file name, size and creation time
- Download backup files from the screen
10External API costs
Keep a daily eye on external API costs
For the external APIs used to fetch SEO data and call AI models, check each provider's balance and this month's spend. With costs visible day by day, you notice overspending early. Daily costs for the last 60 days are listed per provider and in total; results are cached, and “Refresh” fetches them again.
- Balance and this month's spend for each provider
- Daily costs for the last 60 days, per provider and in total
- Filter by provider, and use “Refresh” to fetch the latest figures
* Screens use sample data, with some details such as article titles and keywords blurred. The admin is shown in Japanese. Click to enlarge.
Explore other features
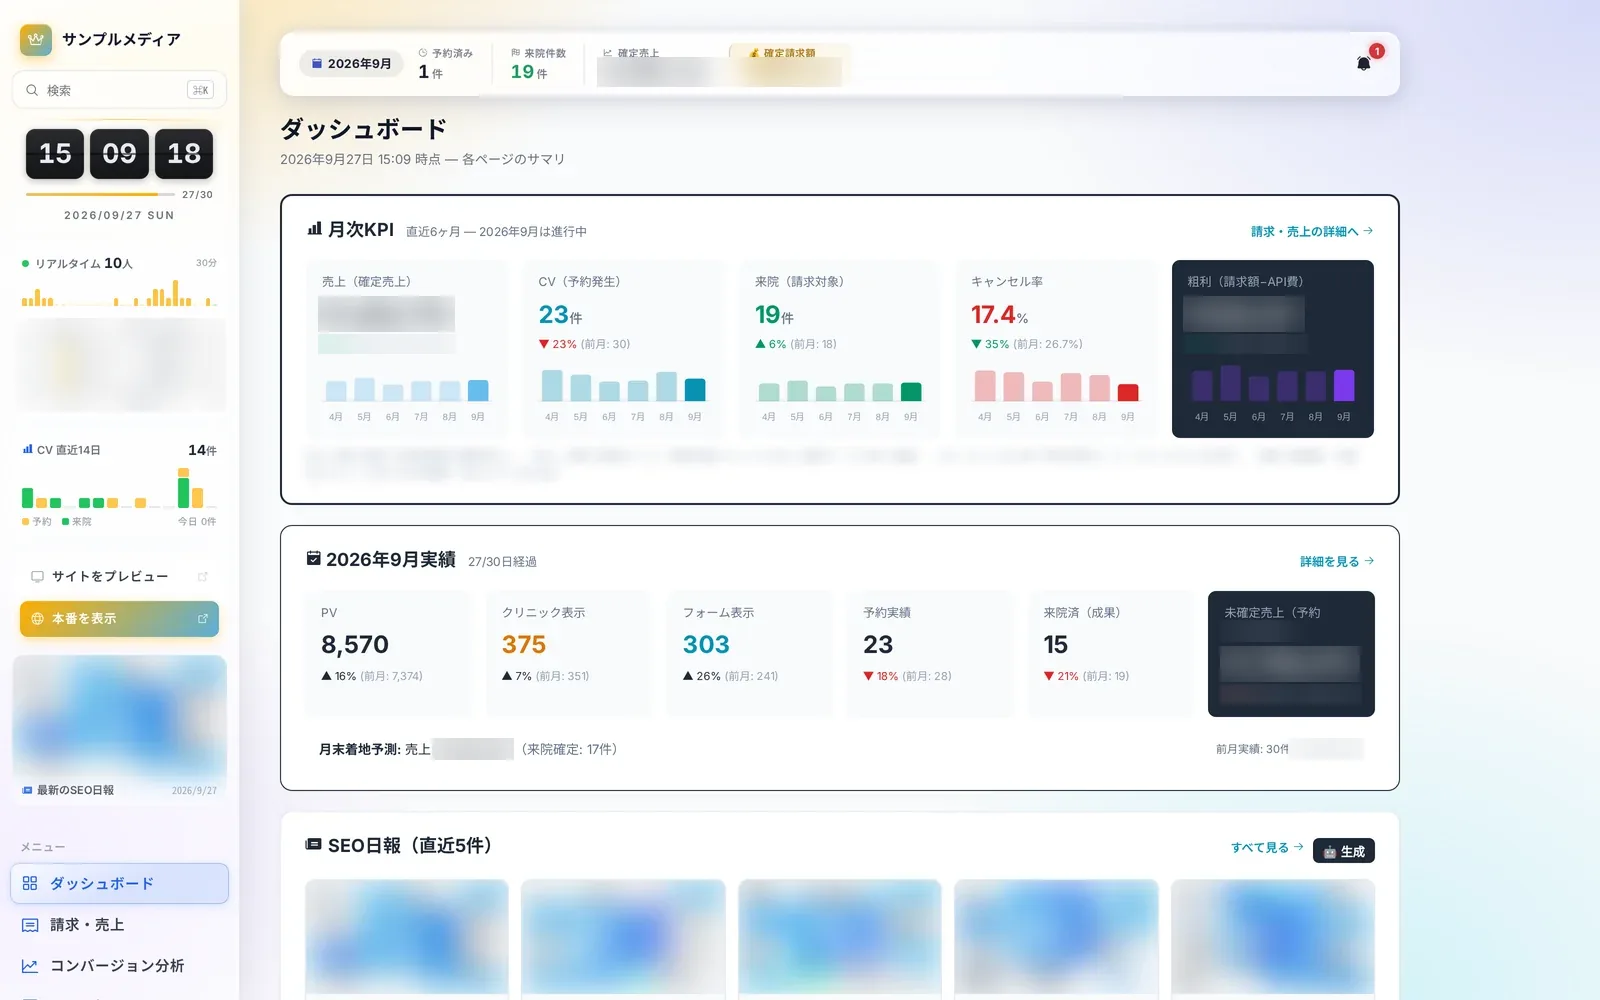 Operations8 screensDaily operationsLearn more
 SEO4 screensSEO and search rankingsLearn more
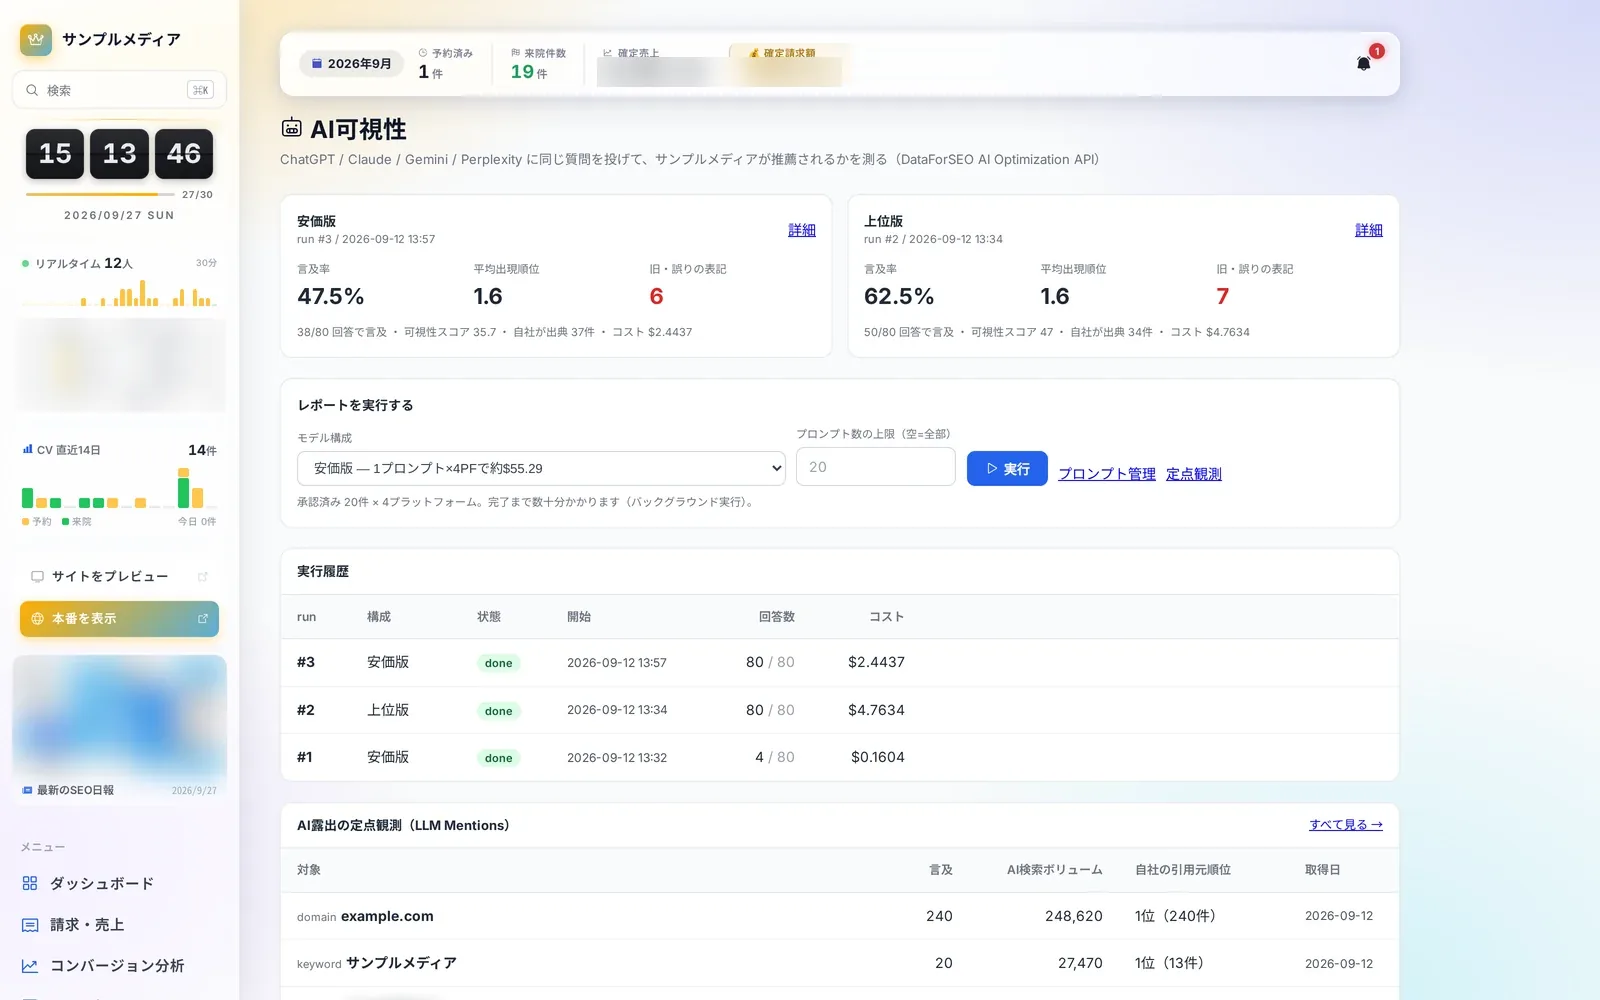 AI Visibility4 screensAI visibilityLearn more
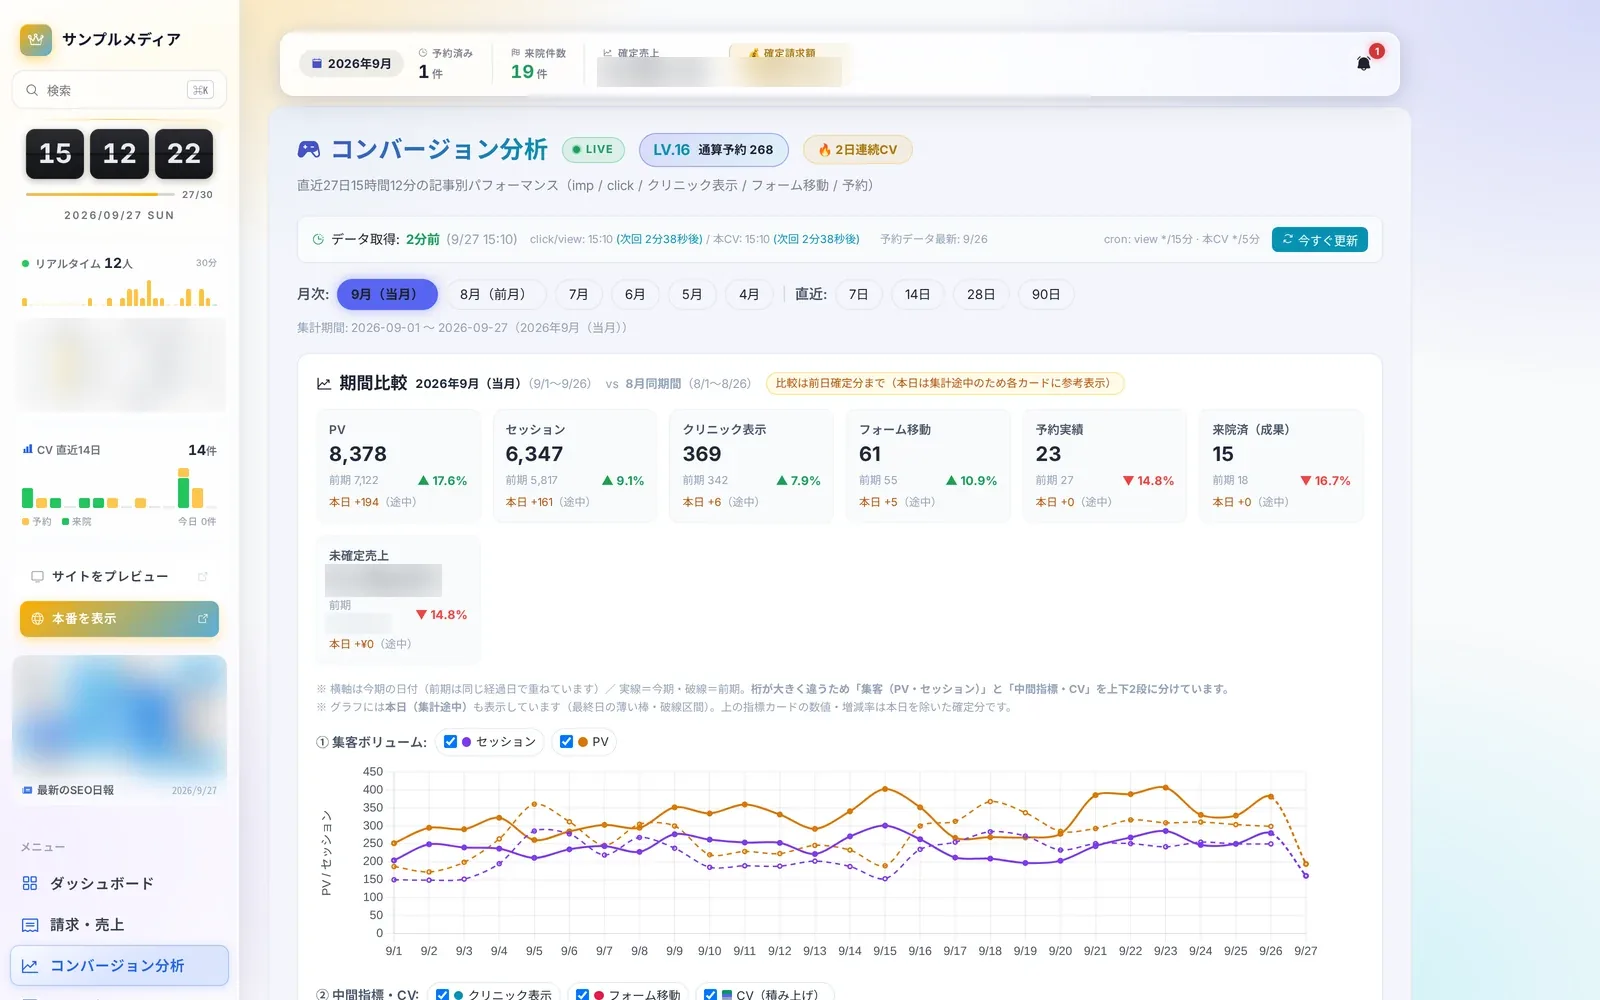 Analytics7 screensConversion analyticsLearn more
 Store Live3 screensStore LiveLearn more
 Content Insights8 screensArticle performance and internal linksLearn more
 Editor & Assets8 screensArticles and assetsLearn more
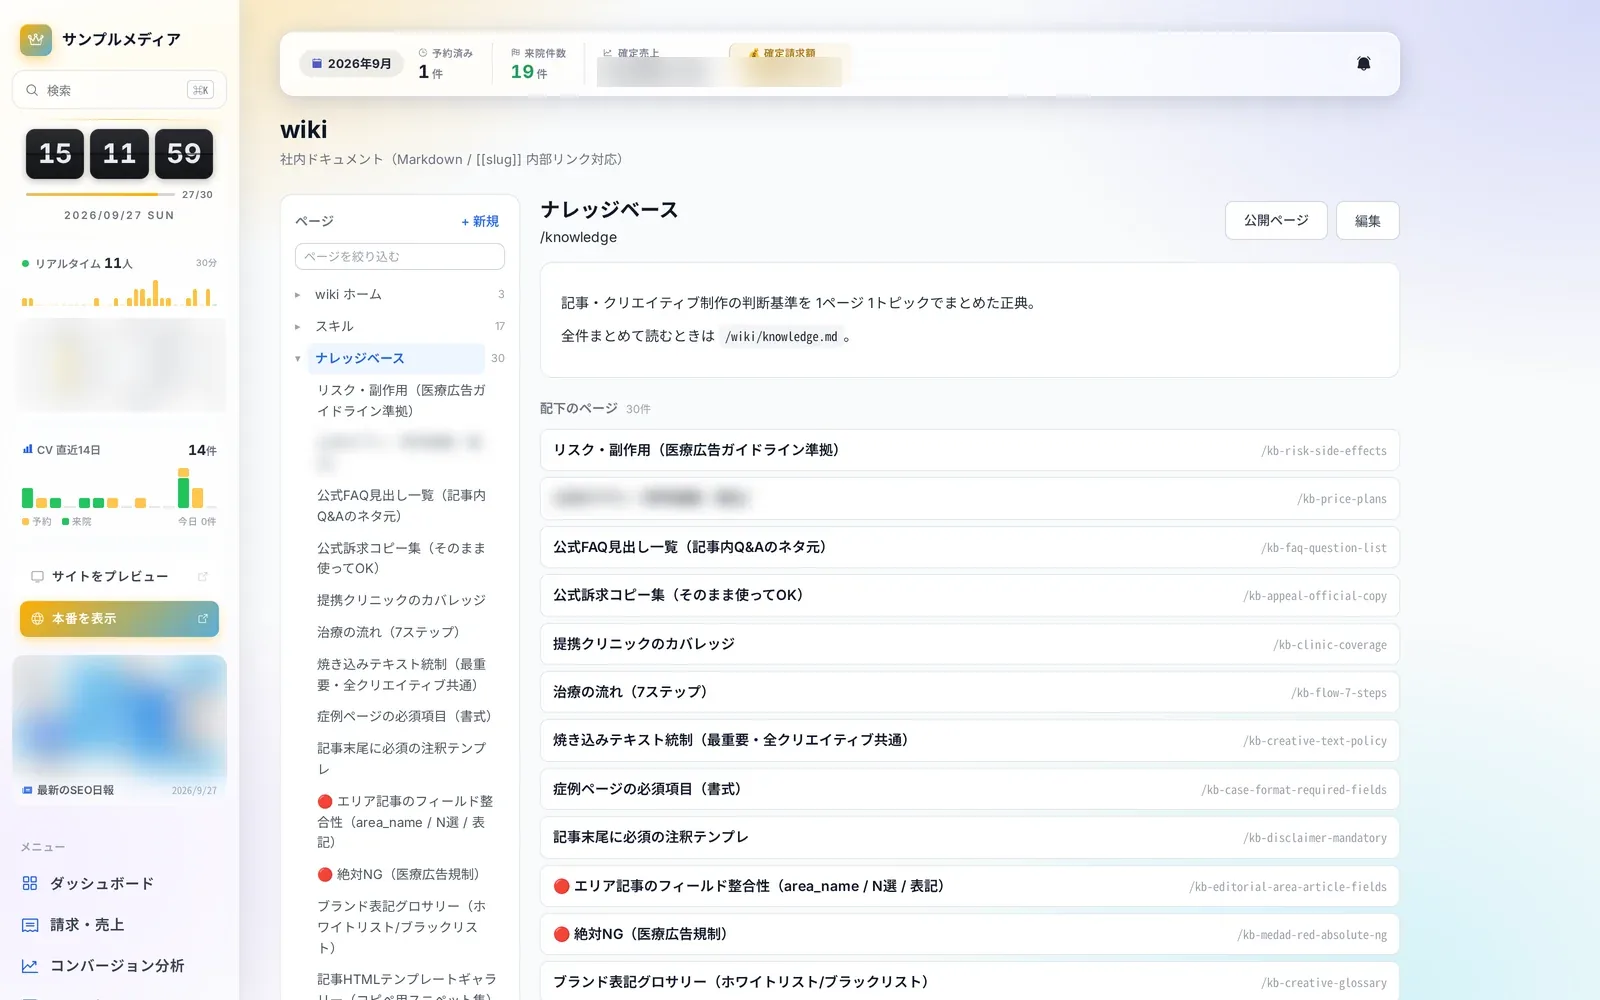 Knowledge4 screensWiki and knowledgeLearn more
Questions about adopting or running Autorial? Talk to us.