Content Insights
Article performance and internal links
Decide which articles to fix and where to add links, based on numbers and diagrams.
Lay out each article's traffic and referrals in quadrants and heatmaps to decide what to work on first. Internal links are analyzed on every build, so you can check their flow, imbalance and breakage in a network graph or as tiles. Post-reading surveys from AI reader agents also help you decide which articles to revisit.
Prerequisites
- Google BigQuery (GA4 export)Metrics for the article scorecard and article matrix
- Google Search ConsoleSearch figures on the article scorecard
- Microsoft Clarity(Data Export API)To add behavior metrics to the scorecard
- An MCP-capable AI agent (e.g. Claude Code)Article reviews by AI readers
Internal link visualization works without any external service.
Google services (BigQuery, GA4, Search Console) connect together through a single service account with read access, and the connection details are registered in the admin's analytics settings.
01Article scorecard
Sort out which articles need work, in four quadrants
Articles are split into four groups at the median of sessions and click-through rate to your referral destinations, labeled hits, rewrite first, strengthen SEO, and likely misses. Articles that attract visitors but fail to refer them call for a rewrite; articles that refer well once read call for SEO work — the next move is clear at a glance. Click a dot on the scatter plot to open that article's details.
- Filter by aggregation window and quadrant
- Hide low-traffic articles so they don't skew the picture
- See the spread on a scatter plot with median guide lines
- Each quadrant suggests a next step, such as scaling up or merging
02Article matrix
Trace when an article started slipping, on a heatmap
An article × date matrix that switches between sessions, page views, clicks to referral destinations, clicks to landing pages, conversions and conversion rate. Color intensity shows the day-to-day ups and downs, so you can spot in one table when a key article's numbers began to fall. You can also filter by article type or subcategory and export to CSV.
- Switch metrics with a single click on the tabs
- Narrow down to key articles, or to articles with data
- Search articles by title or slug
- Export the current table to CSV
03Article reviews (AI readers)
Find an article's weak spots through AI readers
AI reader agents and people read your articles and answer a post-reading survey, and the results are totaled per article. The list starts with the lowest overall scores, so you can review the articles that most need attention from a reader's point of view first.
- Review count and average overall score per article
- Average intent to convert, plus the number of points that felt off
- The latest review date shows how fresh each evaluation is
- Search by article title
04Link equity
Record the state of internal links on every build
Internal links are analyzed on every build, summarizing the number of articles, articles with inbound links, isolated articles, links between articles and more. The broken-link check and the link-count trend across snapshots sit on the same screen. Using a simplified PageRank, it also surfaces articles that gather links but get few page views, and articles with many page views but few links.
- Checks the latest build for broken links such as 404 targets
- Stops the build if broken links increase beyond the baseline
- Charts the link count for each snapshot
- Lists articles where page views and link equity don't match
05Internal link network
See at a glance which articles gather links and which are isolated
A network graph with articles as nodes and internal links as edges shows the link structure of your whole site. Filter by category or show only links on conversion paths to see where links are concentrated. Highlight isolated articles to find the ones that need more links right away.
- Switch categories and search by slug or title
- Show only links on conversion paths
- Highlight isolated articles
- Thin out the graph with a link-weight threshold
06Directory map
Compare link imbalance across directories by area
A treemap of your site's directory structure, where tile area shows PageRank (how much link equity gathers) and color intensity shows the number of inbound links. Isolated articles appear in gray, so thinly linked directories and articles stand out. Click a tile to open that article in the editor.
- Choose the metric used for tile area from a menu
- Color intensity for inbound links, gray for isolated articles
- Grasp the whole site grouped by directory
- Jump from a tile to the article editor
07Link diff between builds
Check which links appeared or disappeared between builds
Pick two build snapshots to compare, and see new links, removed links and links whose count changed, listed by source and destination. It lets you confirm that article edits or template changes haven't removed links you meant to keep.
- Select the two builds to compare by date
- New and removed links, with counts
- Before-and-after counts for links that changed
- Review by source → destination pair
08Map dashboard
Survey article coverage by region on a map
Partner locations and whether each prefecture has articles are drawn on a map styled like an RPG world map. Icons distinguish regions with both partners and articles, partners but no articles, and articles only, which helps you plan the next regional articles to write. Switch the period to review impressions, clicks, page views and micro-conversions alongside.
- Switch the period from 7 to 180 days
- Icons show whether a region has partners and articles
- Totals for impressions, clicks, page views and micro-conversions
- Zoom the map in and out
* Screens use sample data, with some details such as article titles and keywords blurred. The admin is shown in Japanese. Click to enlarge.
Explore other features
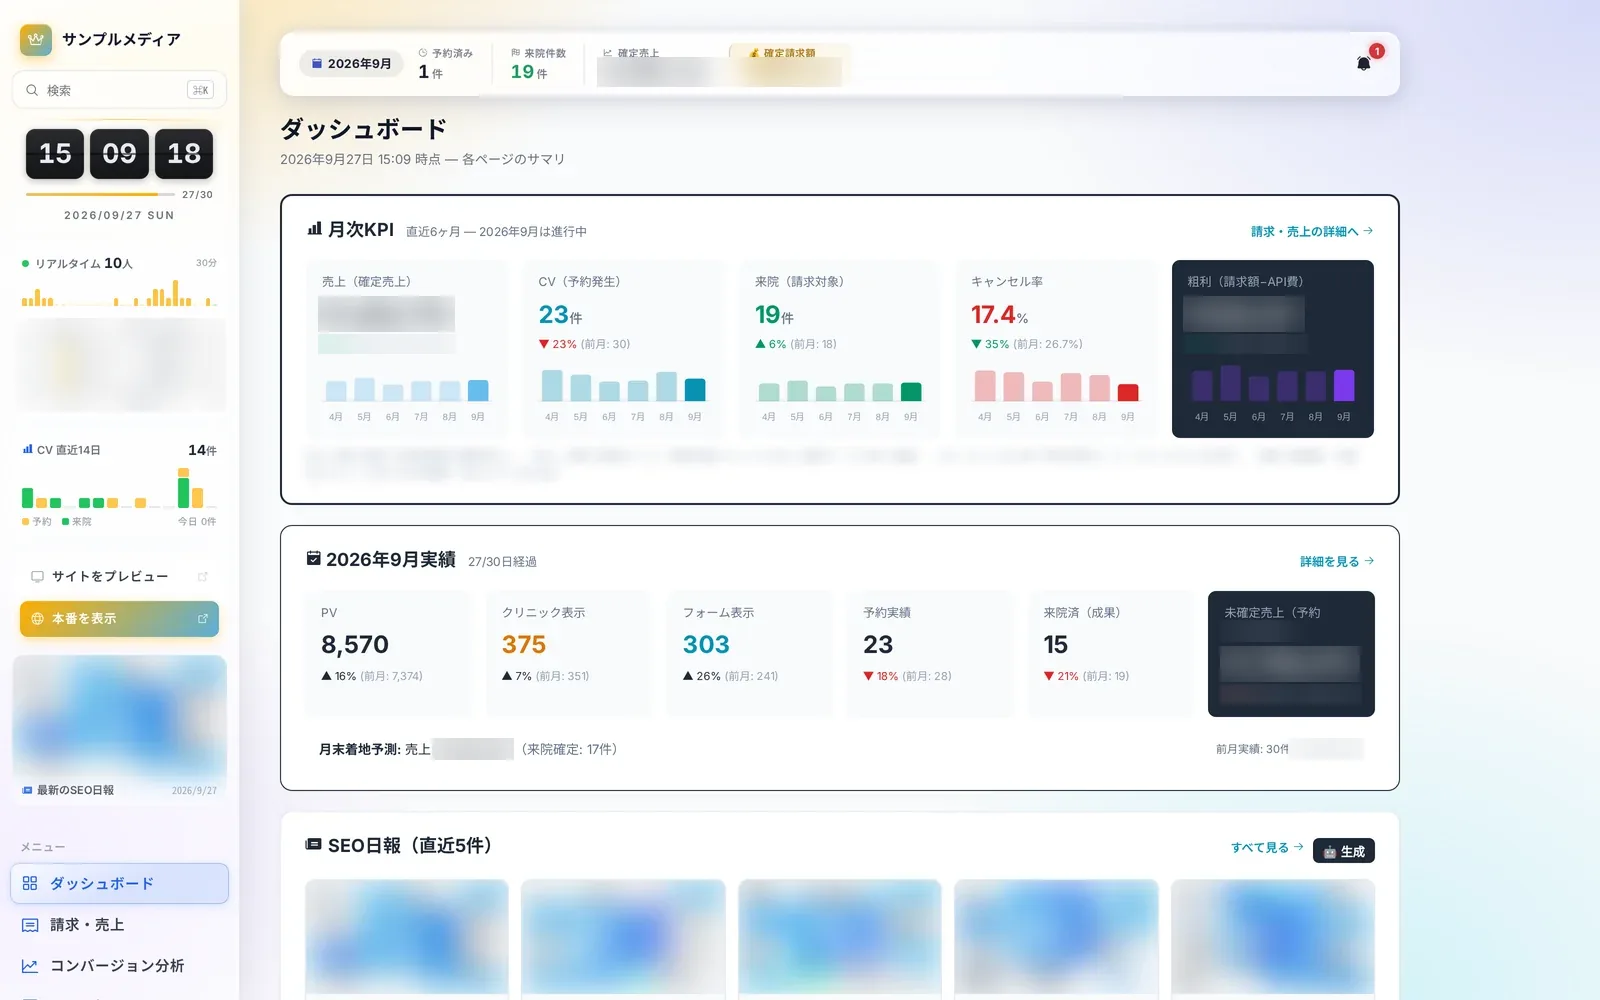 Operations8 screensDaily operationsLearn more
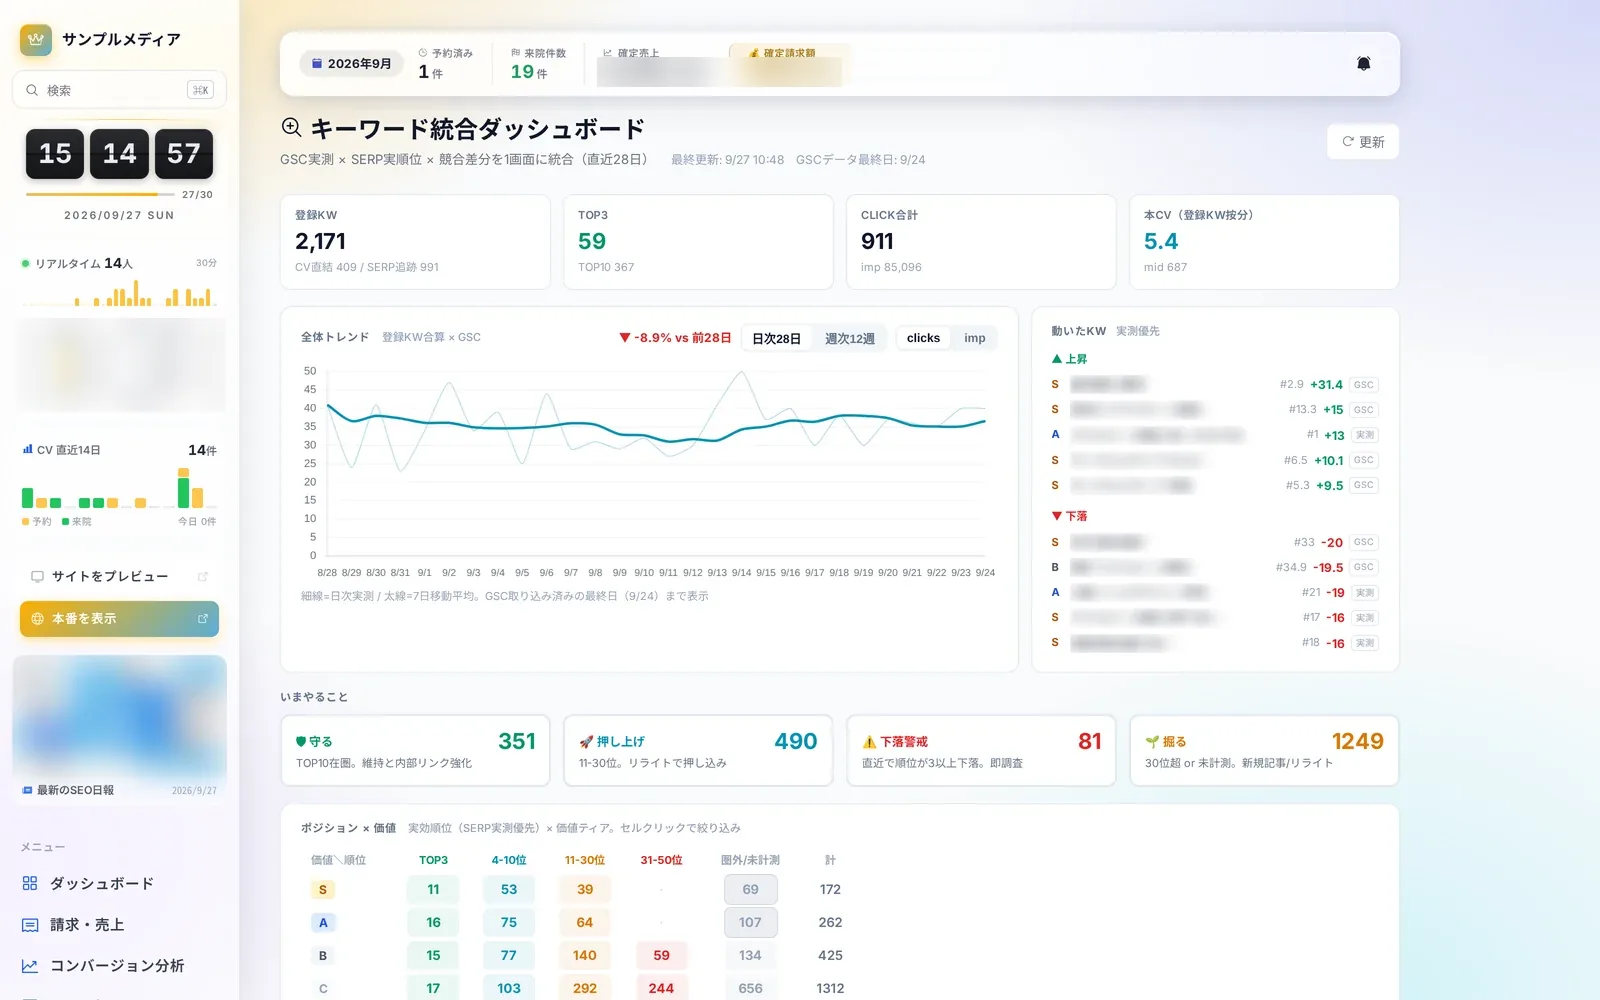 SEO4 screensSEO and search rankingsLearn more
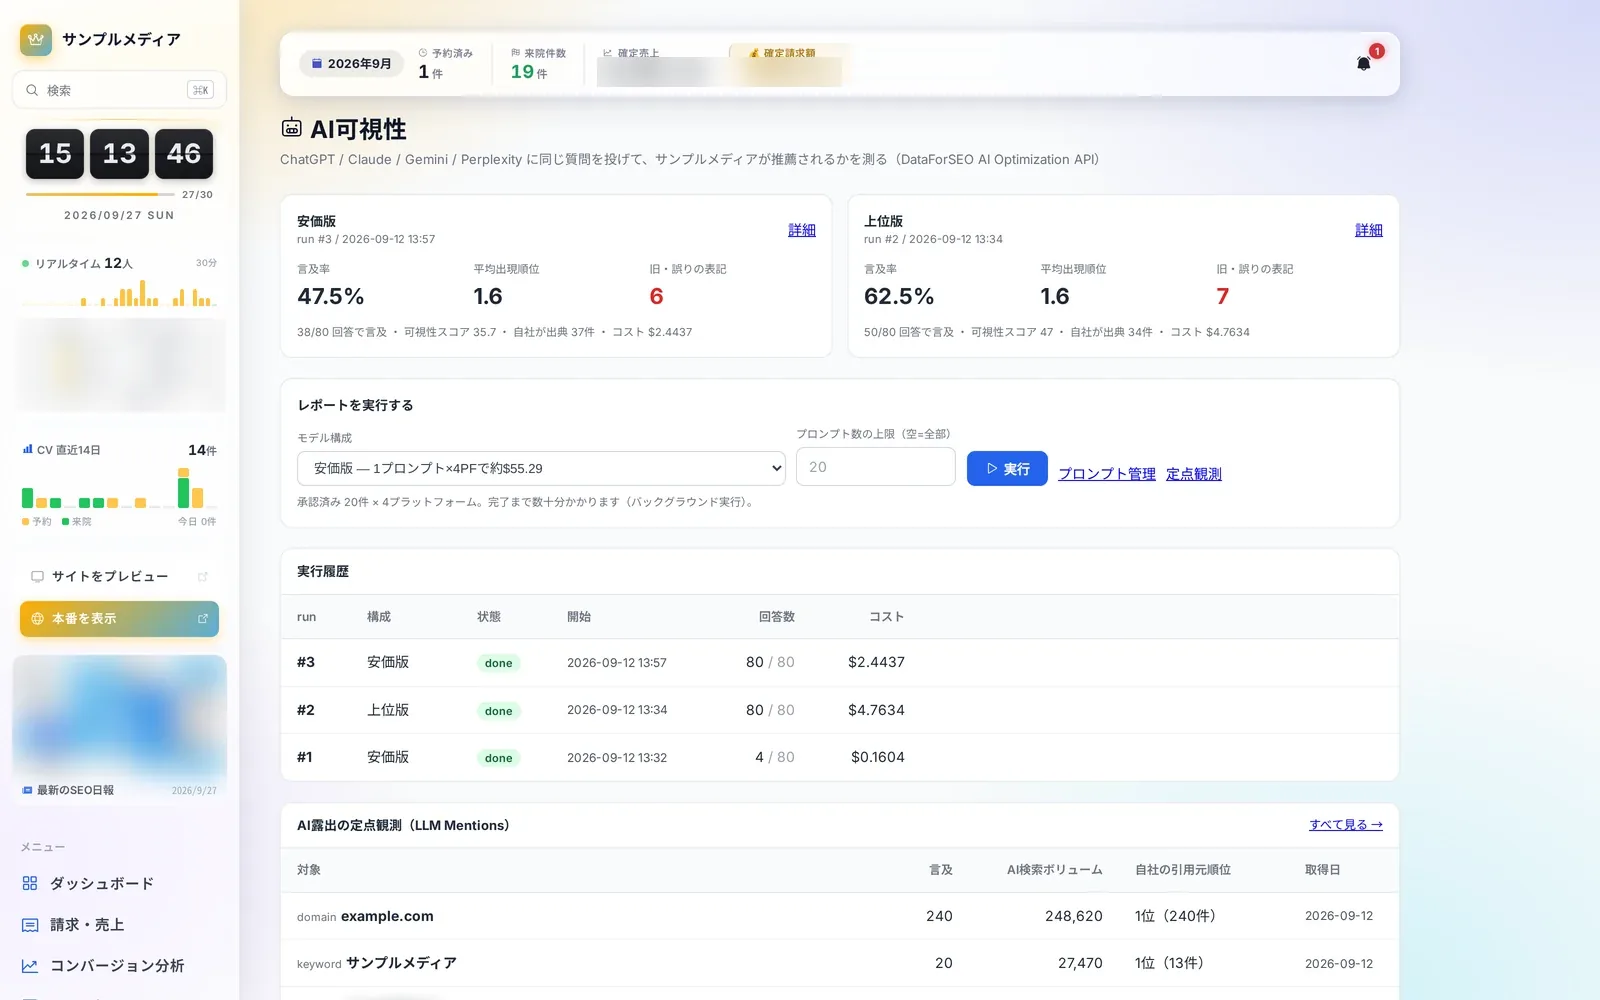 AI Visibility4 screensAI visibilityLearn more
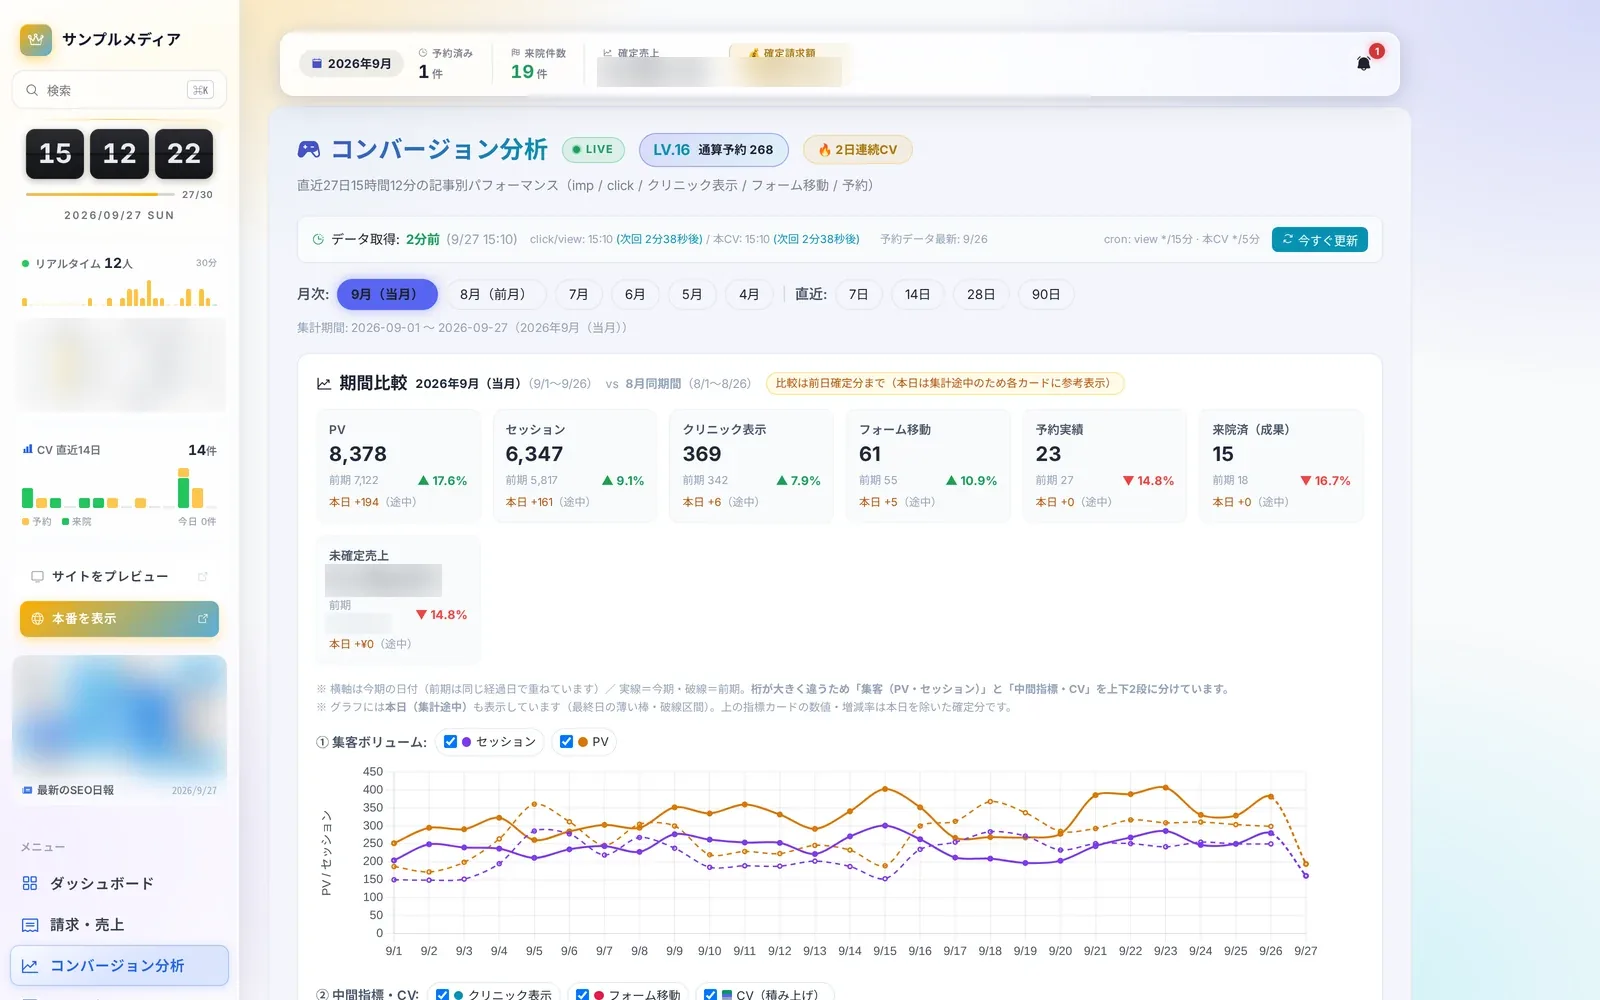 Analytics7 screensConversion analyticsLearn more
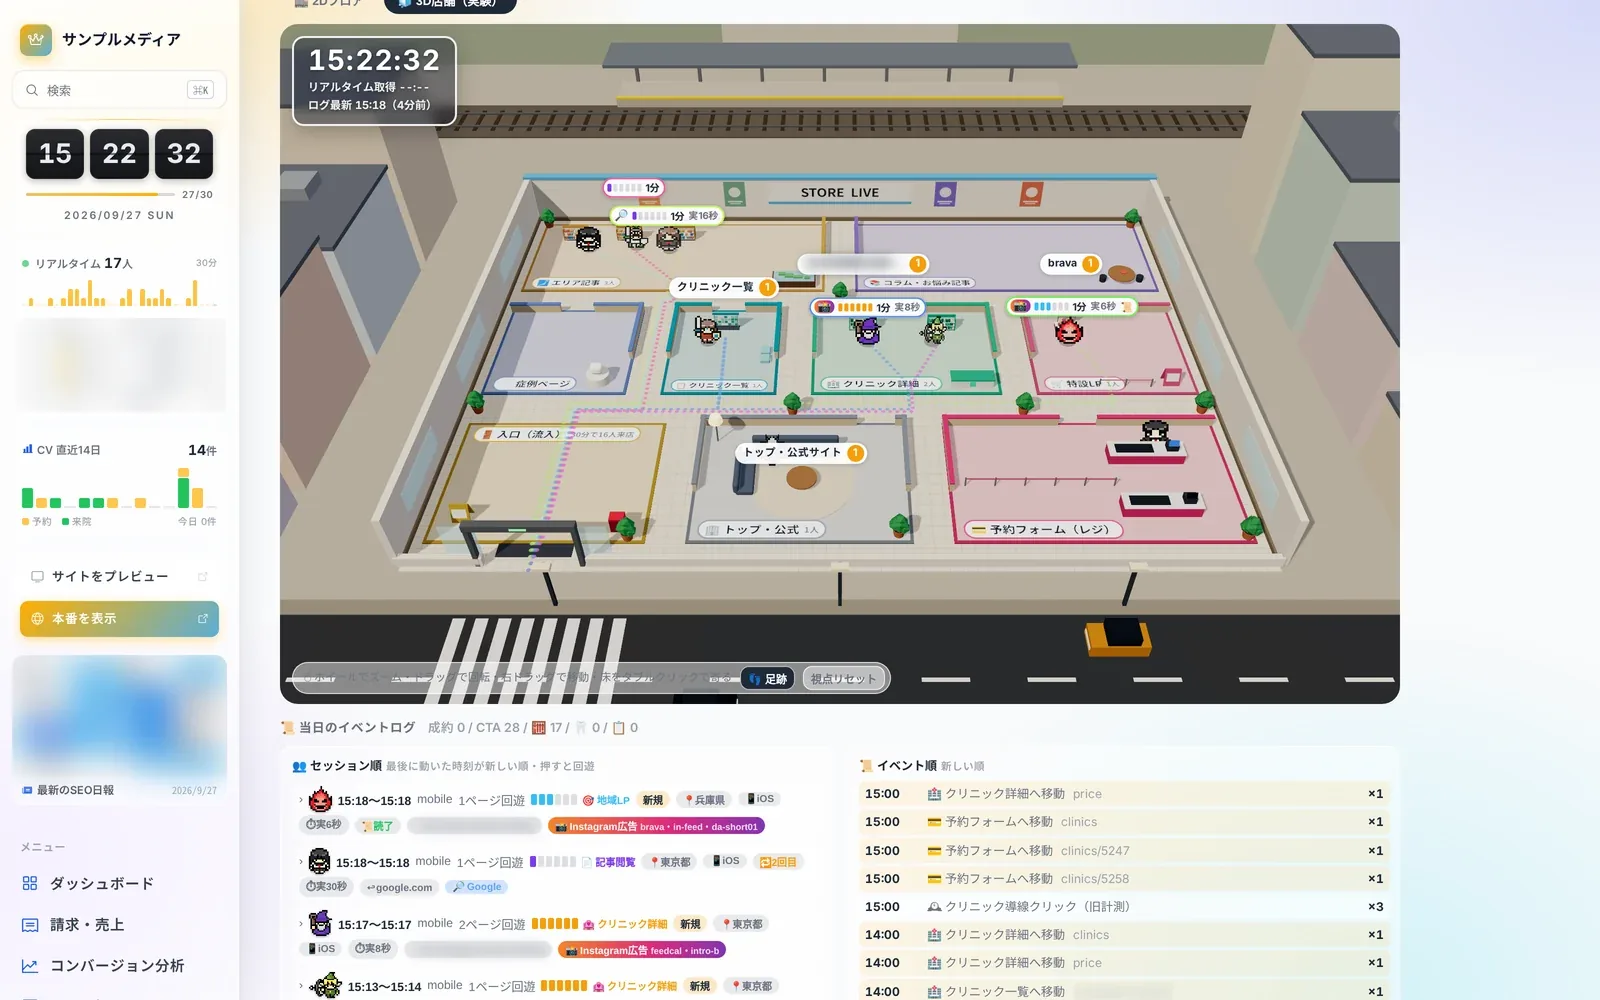 Store Live3 screensStore LiveLearn more
 Editor & Assets8 screensArticles and assetsLearn more
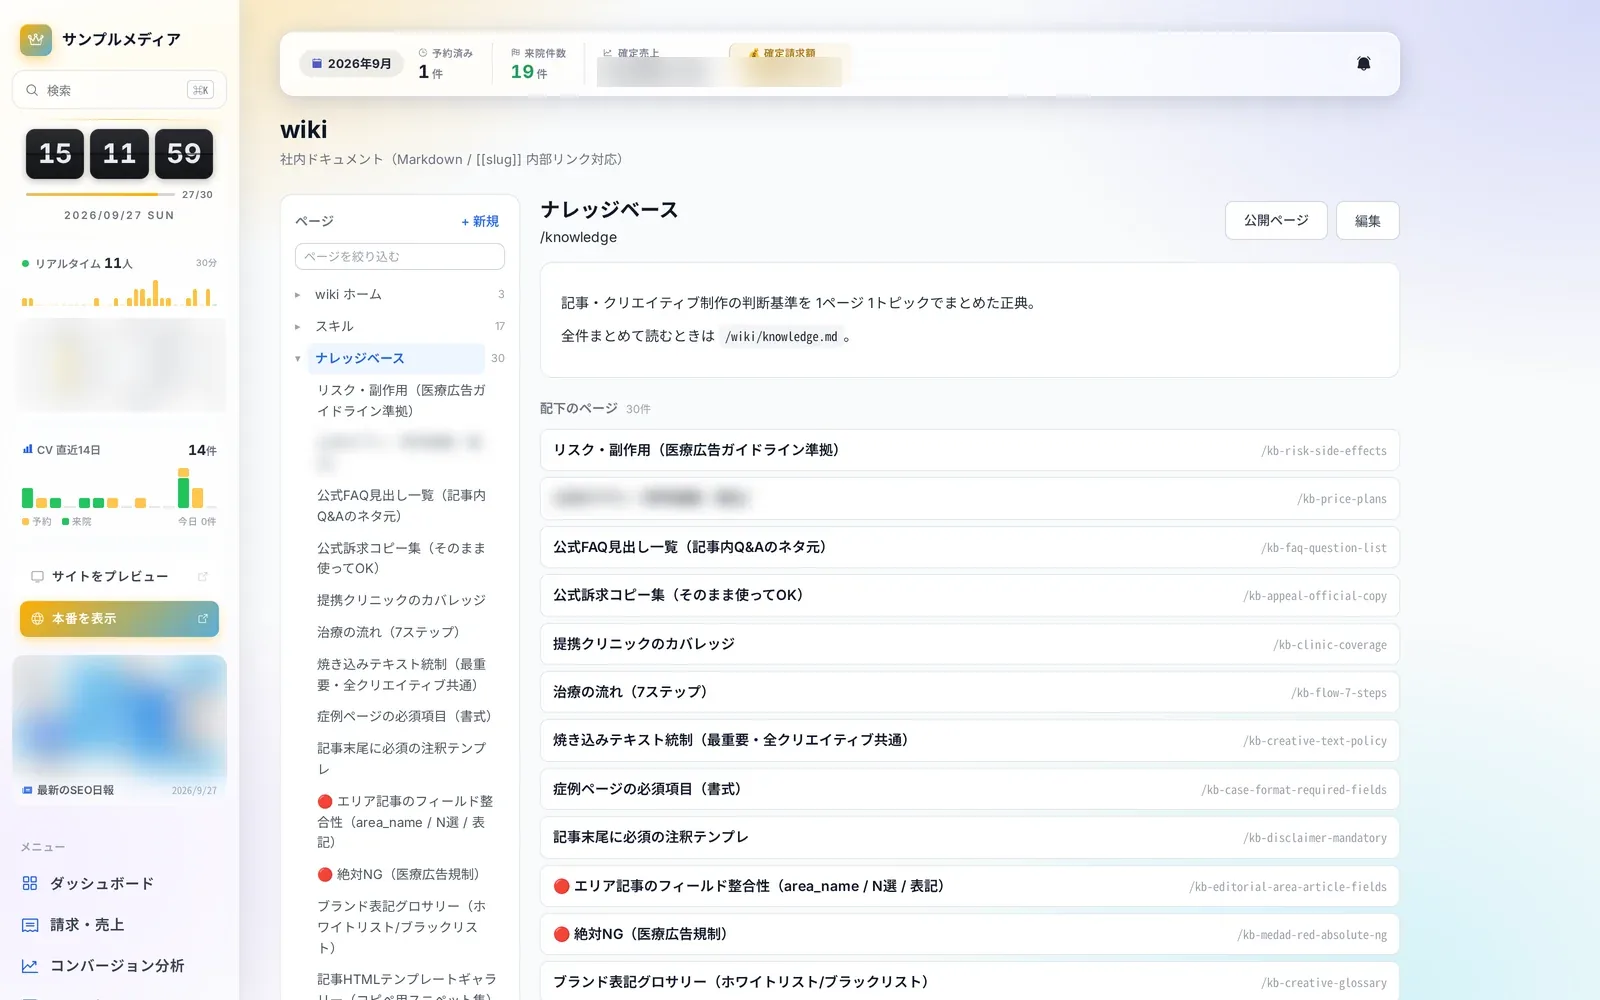 Knowledge4 screensWiki and knowledgeLearn more
 Site Operations10 screensSettings & maintenanceLearn more
Questions about adopting or running Autorial? Talk to us.