Analytics
Conversion analytics
Follow a single line from an article being read to a result.
Beyond page views and sessions, the admin shows the numbers at every step: CTA clicks, landing pages, form visits and conversions such as bookings. With period comparisons, daily reports, path breakdowns, conversion definitions and Microsoft Clarity behavior data, you can pinpoint where readers drop off.
Prerequisites
- Google BigQuery (GA4 export)Conversion analysis, daily analysis and event totals (conversion records also kept in a BigQuery table)
- GA4 Data APILanding-page flows
- Google Search ConsoleSearch figures overlaid on the daily analysis
- Microsoft Clarity(Data Export API)Clarity insights
Conversion definitions (first-party tracking) work without any external service.
Google services (BigQuery, GA4, Search Console) connect together through a single service account with read access, and the connection details are registered in the admin's analytics settings.
01Conversion analysis
This month's results next to the previous period, at a glance
Page views, sessions, referral-destination views, form visits and conversions such as bookings sit side by side as metric cards, each showing the change from the previous period. Choose a month (this month, last month or earlier) or the last 7 to 90 days; the charts draw the current period as solid lines and the previous one as dashed lines. Data refreshes automatically, and you can refresh by hand when you need the latest numbers right away.
- Previous-period value and rate of change for every metric
- Switch between months and the last 7, 14, 28 or 90 days
- Separate charts for traffic volume and for mid-funnel metrics and conversions
- Last fetch time and a "Refresh now" button
02Daily analysis
From search impressions to bookings, with drop-off by landing page
A summary of search impressions, page views, sessions, referral-destination views, form visits and conversions, totaled over the period you choose. It shows the pass-through rate from view to CTA click for each landing page, and lists pass-through and drop-off rates by landing page and referrals by source page, each with a small trend chart. The numbers on screen can be downloaded as CSV.
- Periods of 14, 30, 60, 90 or 180 days
- View → CTA click pass-through rate per landing page
- Pass-through and drop-off by landing page, compared with the previous period
- Referrals by source page, plus CSV download
03Daily report
Review a single day's results article by article
Pick a date to see that day's Search Console impressions and clicks, page views, referral-destination views, form visits and conversions. The per-article table lines up impressions, clicks, position, page views, referrals and bookings, so you can trace which articles led to that day's results. Move to the previous or next day with a single button.
- Jump to the previous or next day, or back to the list
- Search Console impressions and clicks on the same screen
- A landing page view → CTA → referral destination funnel
- Impressions, clicks, position, page views, referrals and bookings per article
04Event totals
Break the path from CTA to conversion into steps
Alongside page views, CTA clicks and form visits, site-specific events such as interactions with in-article tools are totaled as counts and daily averages. The "Path to conversion" view takes article views as 100% and shows how many sessions reach each step — broken down by CTA destination, then landing pages, listings, detail pages, forms and conversions — compared with the previous period. You can see at which step readers stop.
- Periods of 7, 14, 28, 60 or 90 days
- Count and daily average for each event
- Breakdown and share by CTA destination
- Sessions reaching each step, with change from the previous period
05Landing-page flows
Check landing-page flow changes against deploy dates
Metric cards link article page views to referrals, landing pages and form arrivals, showing the pass-through and drop-off rate at each step. The daily trend chart marks the dates of production deploys; hover over a mark to see what was released that day. You can overlay Search Console data too, and compare how site changes showed up in the numbers.
- Pass-through and drop-off from article → landing page → form
- Breakdown of the articles sending traffic to each landing page
- Production deploy dates overlaid on the daily trend
- A toggle to overlay Search Console data
06Conversion definitions
Decide what counts as a conversion, with first-party tracking
Register conversion definitions in the admin, measured with first-party tracking that doesn't depend on GA4 or BigQuery. Conditions can be an event name or an outbound link URL, and each definition shows its count for the last 7 and 30 days and its value per conversion. Recent conversions appear in a log with the page URL, traffic source and device.
- Define conversions by event name or link URL
- 7-day and 30-day conversions and value per conversion for each definition
- Add, disable, edit or delete definitions
- The latest 30 conversions with page URL, source and device
07Clarity insights
Clarity behavior data by URL, right in the admin
Microsoft Clarity data is imported on a schedule, with totals for dead clicks, rage clicks, quick backs, excessive scrolling and script errors. Narrow down or exclude pages by URL path, and compare sessions, scroll depth and active time per URL to find the pages where readers struggle. You can also refresh manually within the remaining API quota.
- Totals for dead clicks, rage clicks and more
- Include or exclude pages by URL path prefix
- Sessions, scroll depth and active time by URL
- Scheduled automatic import plus manual refresh
* Screens use sample data, with some details such as article titles and keywords blurred. The admin is shown in Japanese. Click to enlarge.
Explore other features
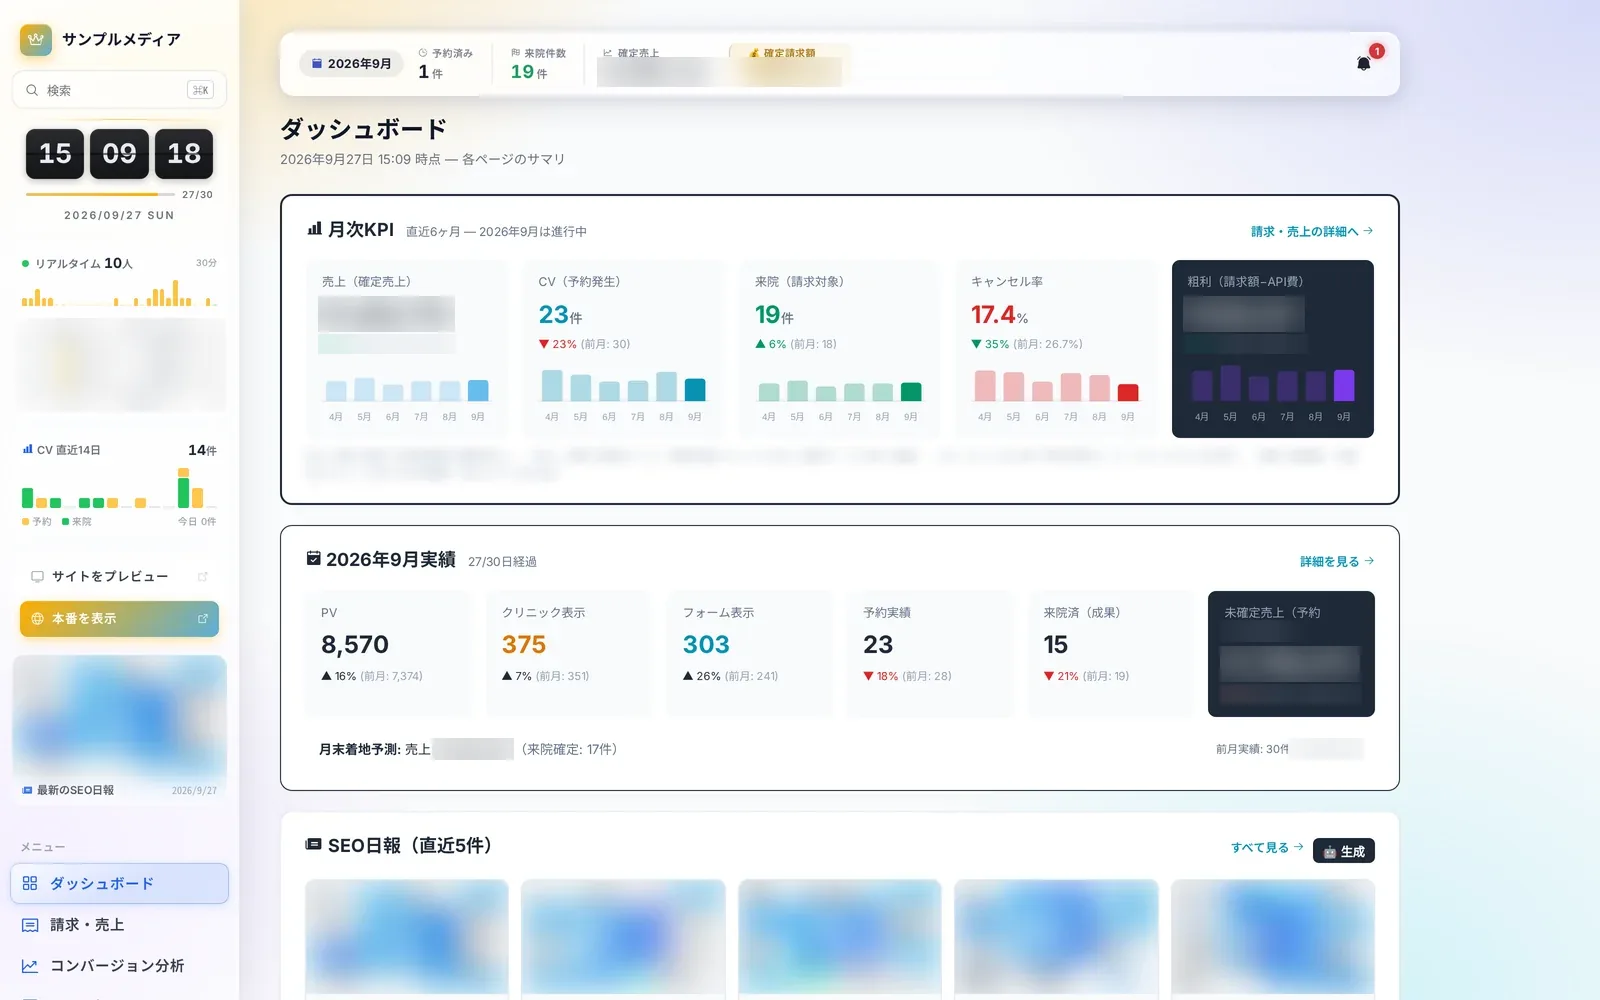 Operations8 screensDaily operationsLearn more
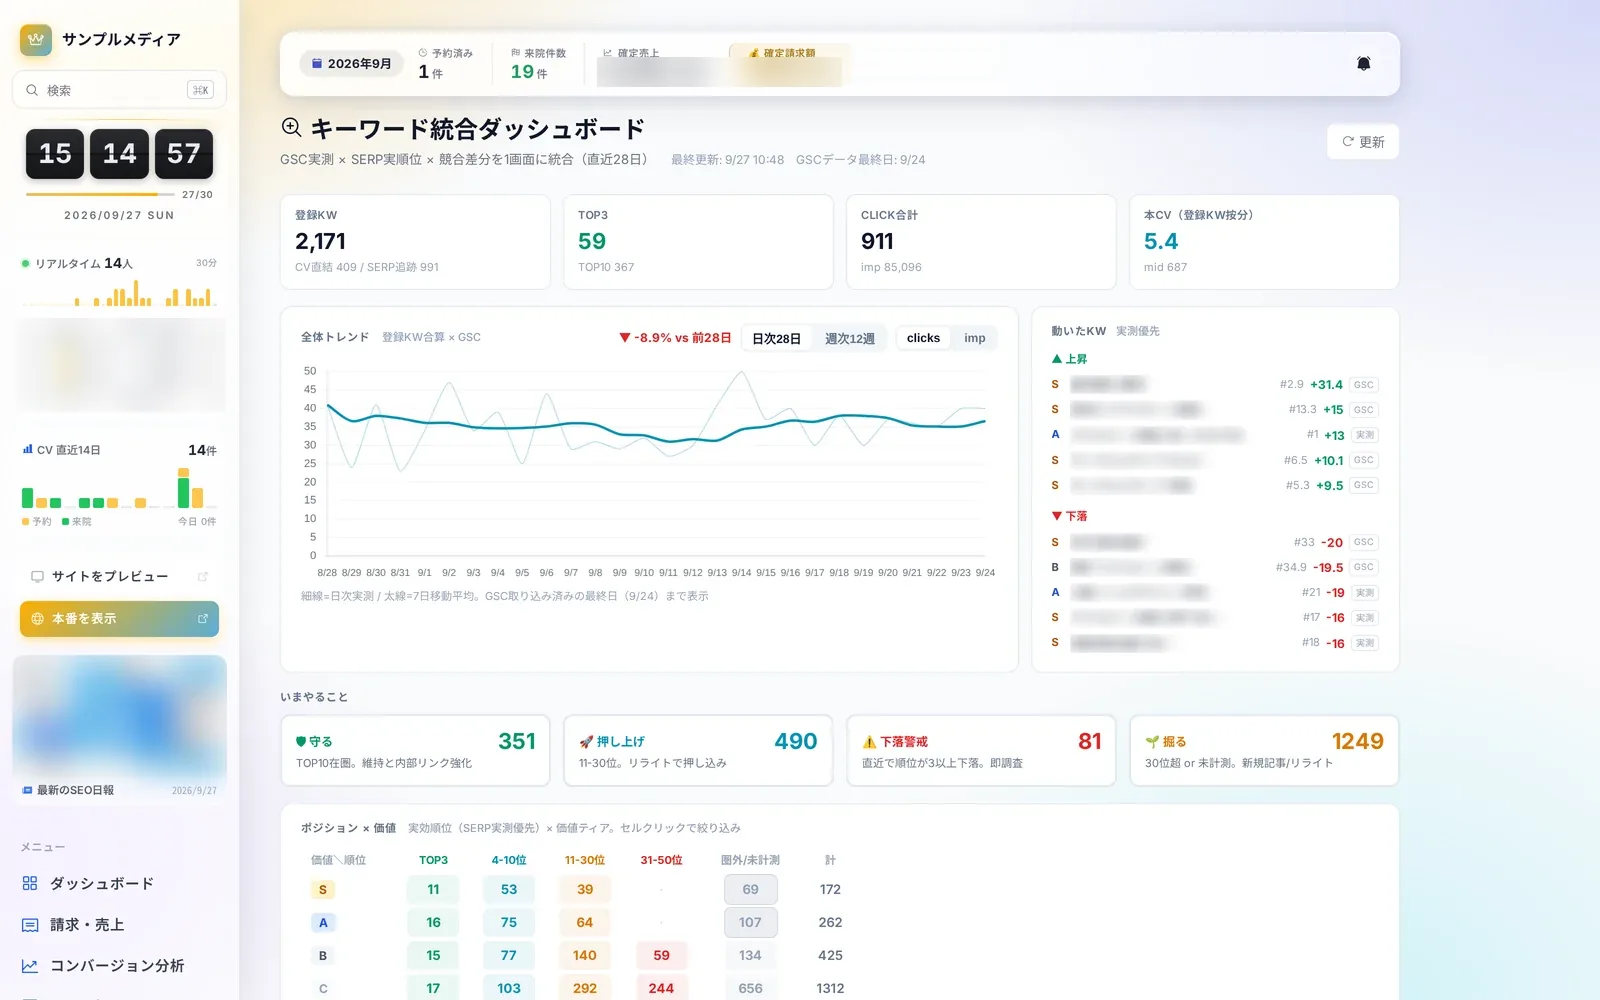 SEO4 screensSEO and search rankingsLearn more
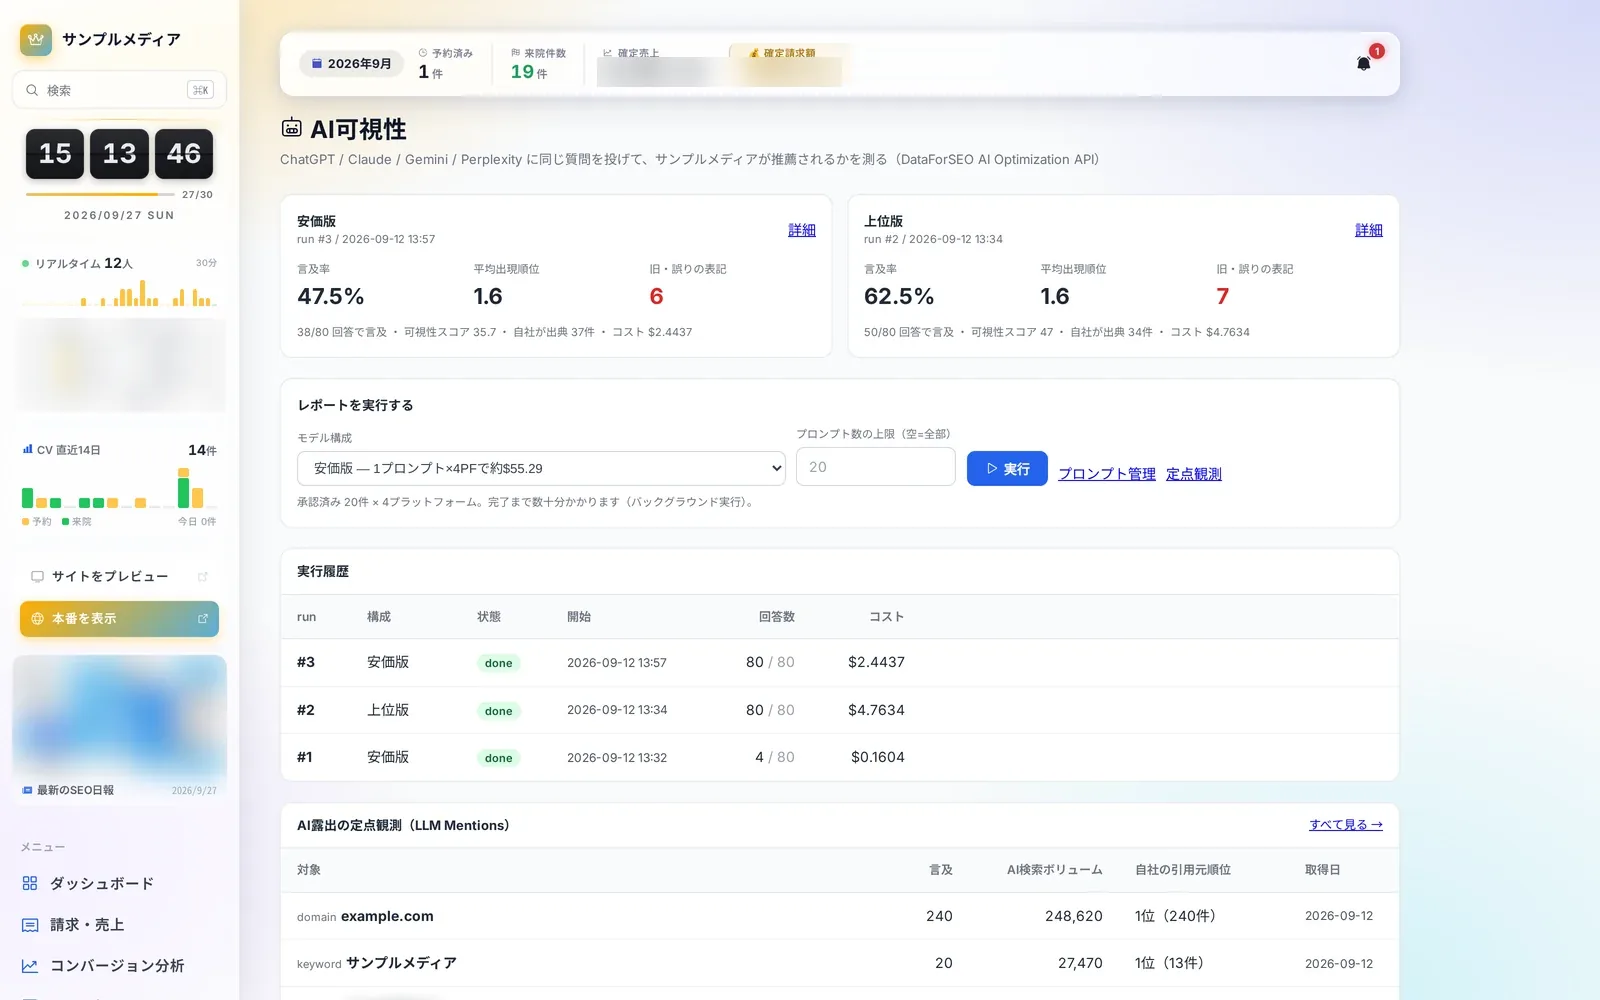 AI Visibility4 screensAI visibilityLearn more
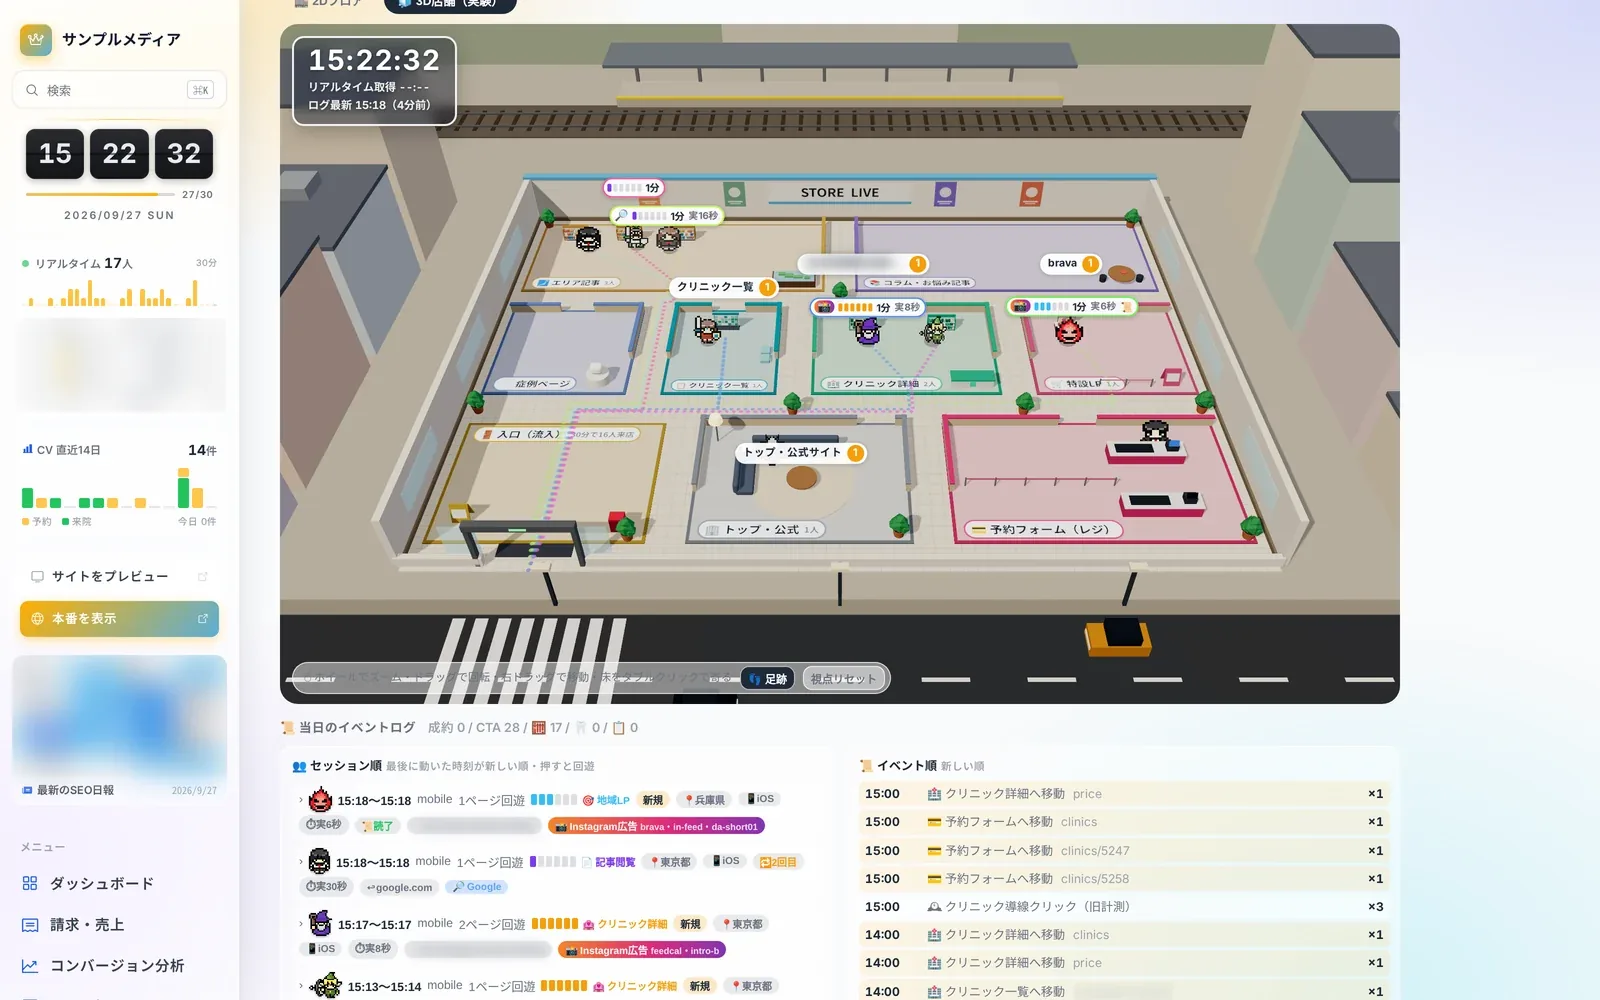 Store Live3 screensStore LiveLearn more
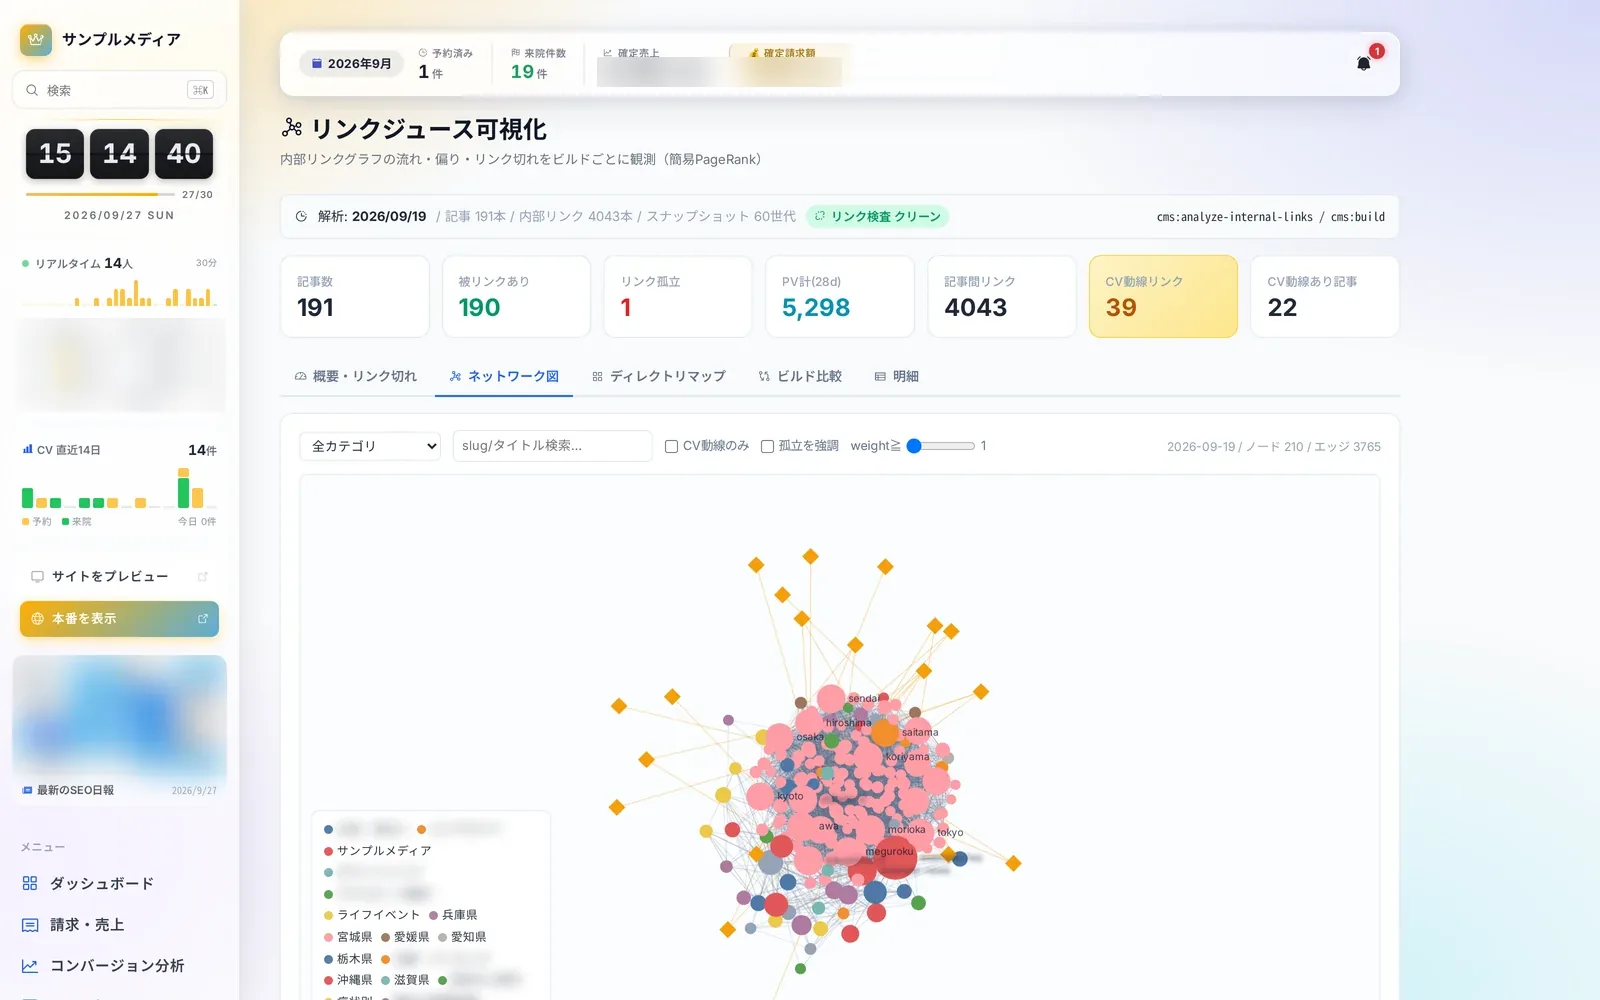 Content Insights8 screensArticle performance and internal linksLearn more
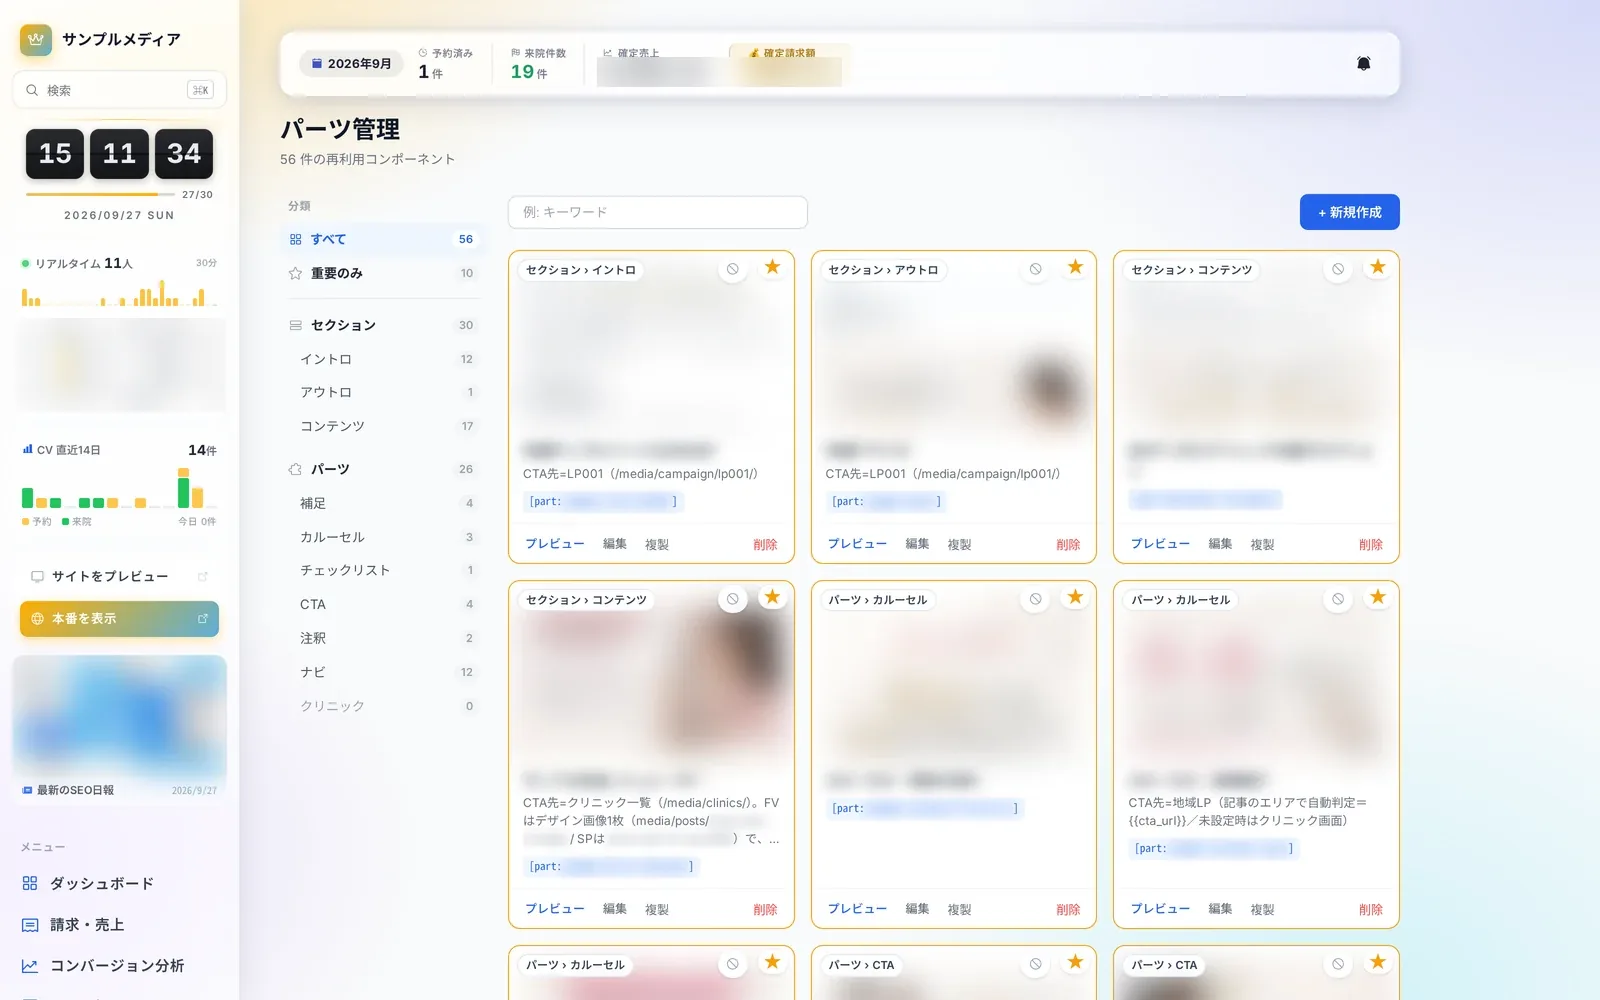 Editor & Assets8 screensArticles and assetsLearn more
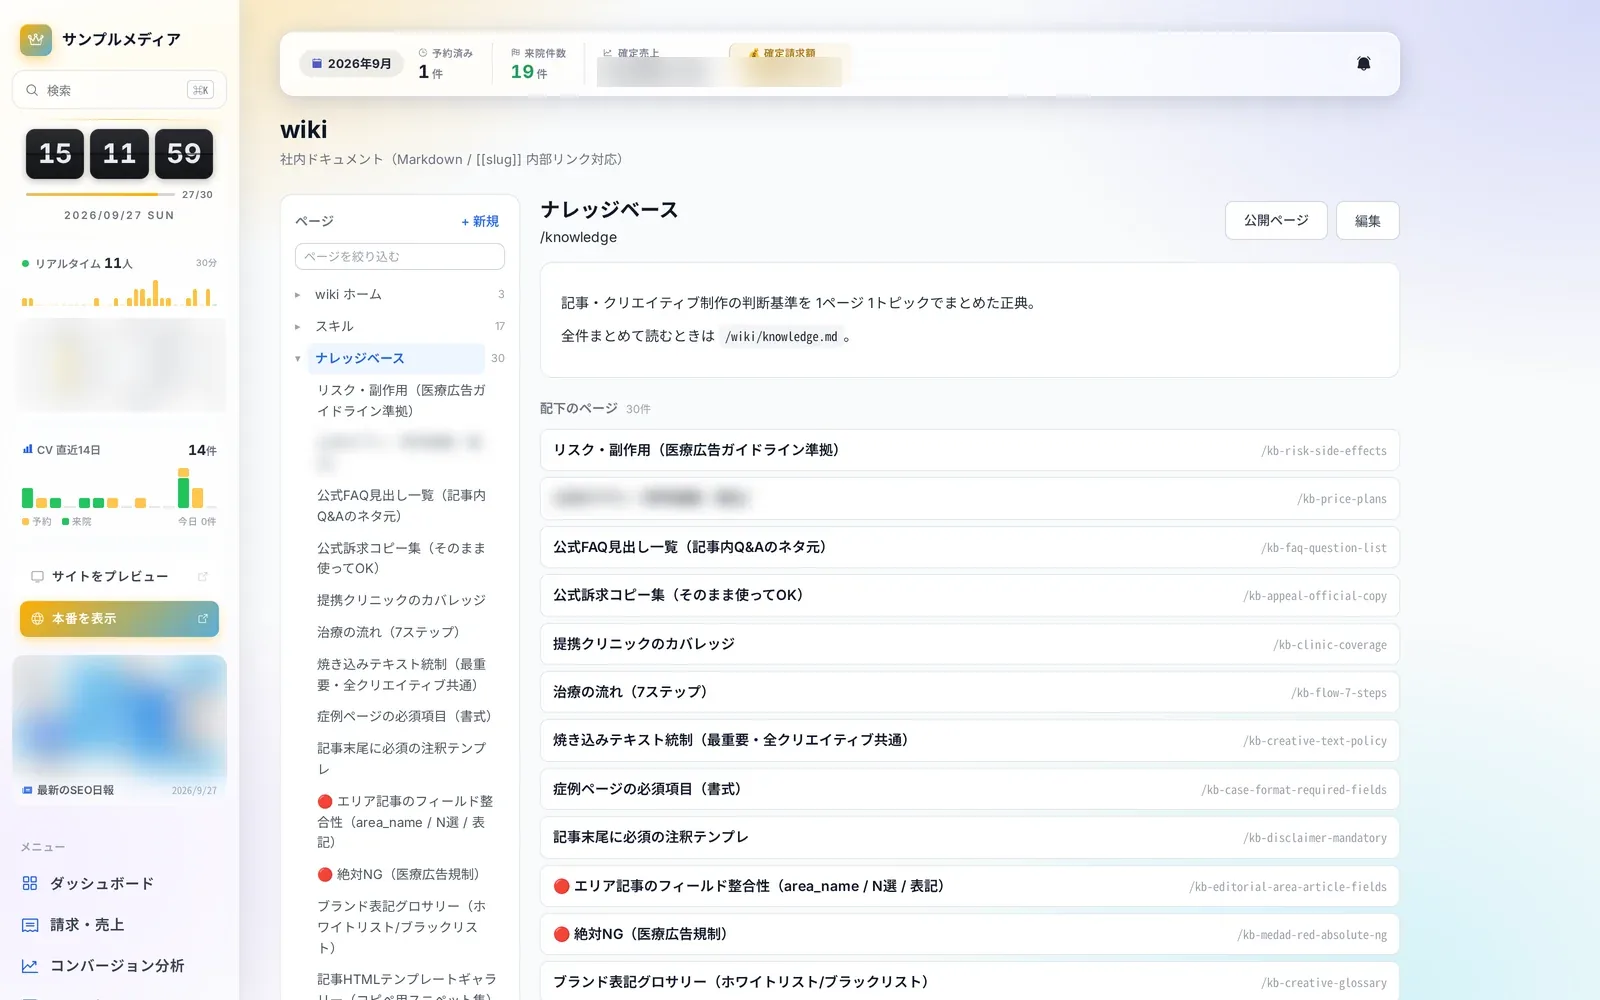 Knowledge4 screensWiki and knowledgeLearn more
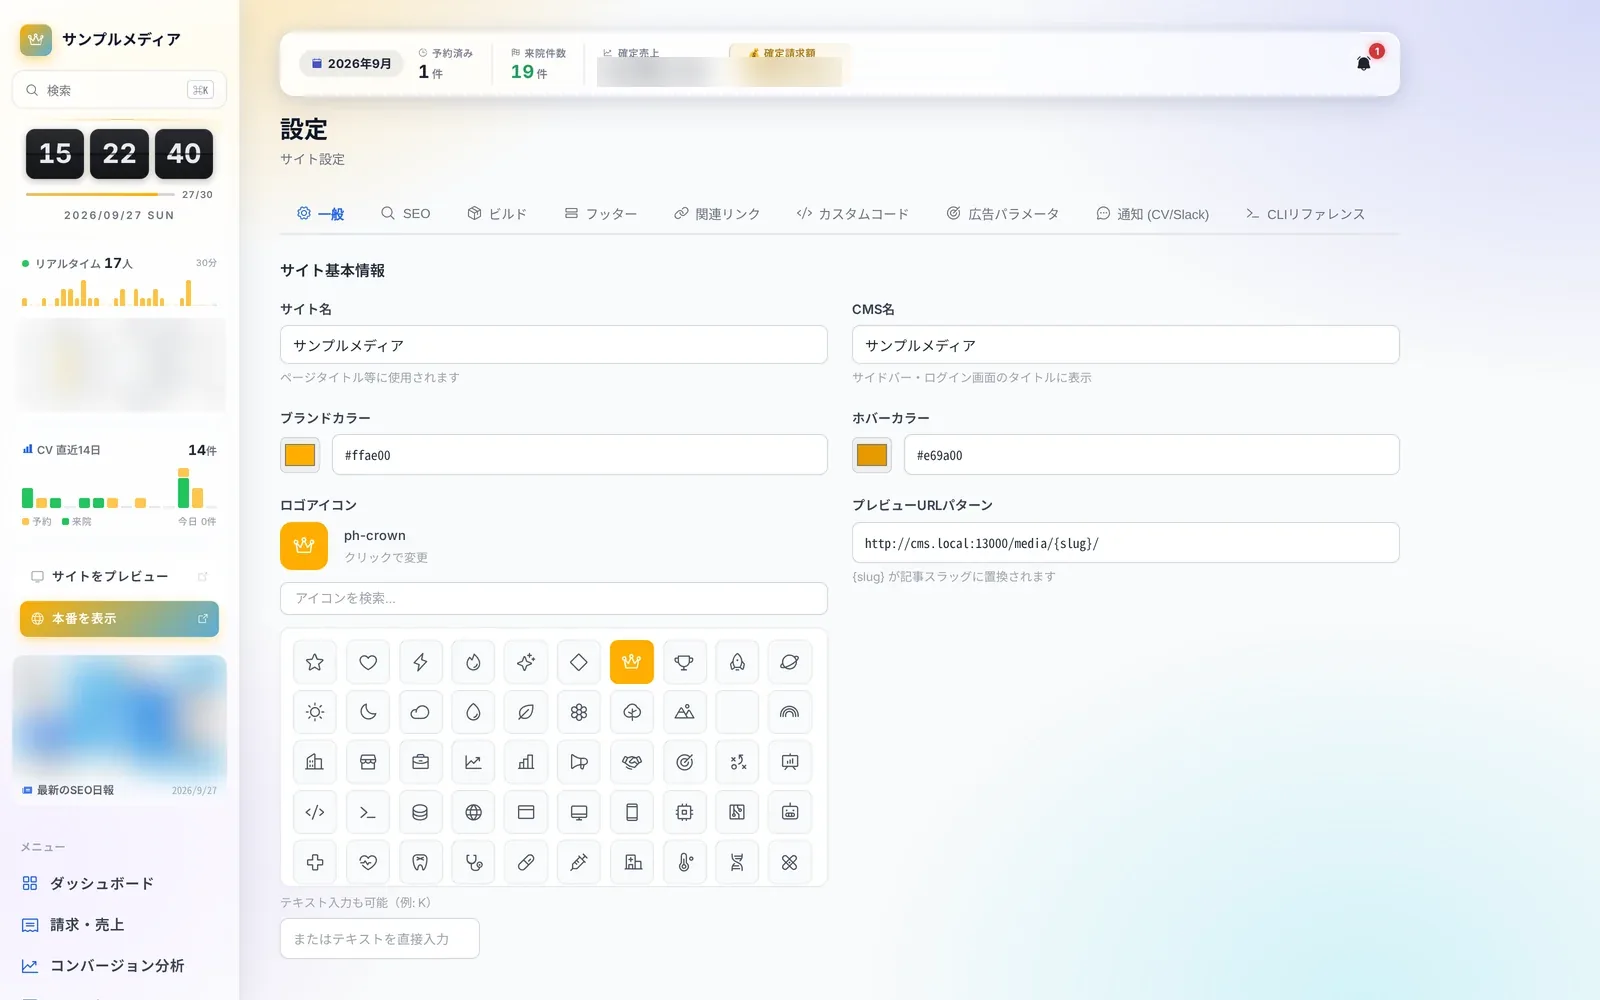 Site Operations10 screensSettings & maintenanceLearn more
Questions about adopting or running Autorial? Talk to us.